Now running 11.2

Aiven for Grafana®

Get Grafana as a fully managed service to observe your metrics data and alert on events. Snap ready-made dashboards into your monitoring workflows and get the big picture on your systems.

Deploy on

Amazon Web Services logo in white
Google Cloud logo in white
Microsoft Azure logo in white
Digital Ocean logo in white
UpCloud logo in white
Get started for free

No credit card required.

How it works

How does Aiven for Grafana® work?

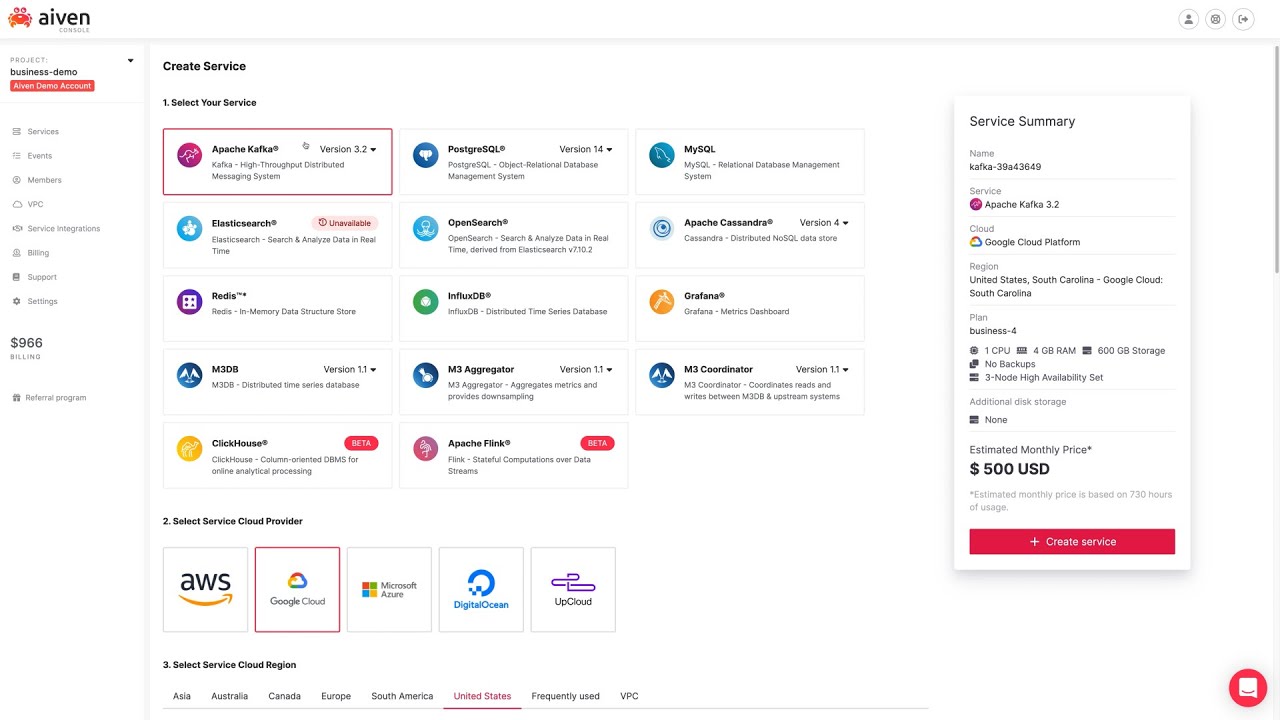
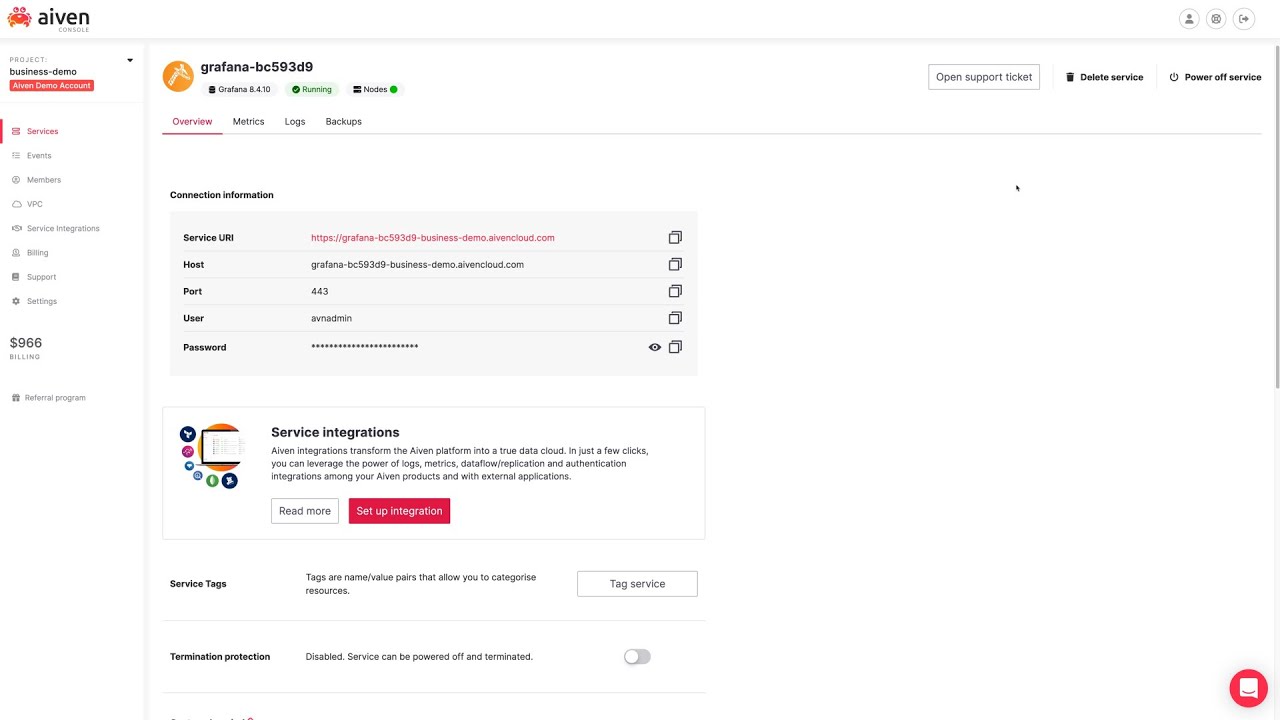
Set up fully managed Grafana in less than 10 minutes — directly from our web console or programmatically via our API, CLI or Terraform provider. Create smart visualizations and alerting rules for all kinds of metrics. Includes integrations and pre-built dashboards for monitoring the health of your Aiven services.

LogsAiven for ClickHouse®Aiven for PostgreSQL®Aiven for M3Aiven for OpenSearch®DatasourceDashboardsAiven for M3Aiven for PostgreSQL®MetricsAiven for Grafana®

Manage with the tools you want:

Terraform logo

Terraform

Kubernetes logo

Kubernetes

GUI logo

GUI

CLI logo

CLI

API logo

API

Postman logo

Postman

Benefits

Benefits of Grafana® as-a-service from Aiven

With Aiven for Grafana, you can set up a monitoring solution for your system health or your business metrics in just a few clicks. Pre-built dashboards make monitoring Aiven data services easy, so you can keep an eye on your system health, and set alerts for anything out of the ordinary.

One-click integration to data in Aiven services makes it simple to build business dashboards. And if this isn’t enough, we provide more additional data source and dashboard plugins than any other provider.

Automatic updates and upgrades. Zero stress.

Stressing about applying maintenance updates or version upgrades to your clusters? We’ll take care of them for you. With no interruptions or downtime. Ever.

Super-transparent pricing. No networking costs.

Aiven for Grafana comes with all-inclusive pricing. No hidden fees or charges – just one payment that covers everything you need.

99.99% uptime. 100% human support.

Downtime is a disaster for critical applications. That’s why Aiven makes sure you get 99.99% uptime. Plus, you get access to a 100% human support team — in case you need a helping hand.

Over 60 data source and panel plugins.

Connect the dots between your external data sources – and personalize how you visualize that data – with support for 60+ plugins.

Read more

Customer use cases

How Aiven customers use Grafana

Telemetry visualization

Gather all the metrics from remote sources such as IoT devices or sensors, and visualize all the information on one or more dashboards. With at-a-glance overviews of data points over time, it’s easier to identify trends and make informed business decisions.

Observability

Effective observability offers granular insights into your whole system, helping to ensure it remains healthy at all times. Find out how Aiven built our own observability platform – using M3, Grafana and OpenSearch – to help us maintain our 99.99% uptime promise.

Business metrics

With Grafana as a business monitoring tool, it’s easy to set up dashboards with metrics monitoring for individual teams or departments. Grafana can help teams optimize performance through actionable information, regardless of their technical skill sets.

Features

Key features of Aiven for Grafana®

Set up

Flexible, fast and stress-free

  • Production-ready Grafana clusters in 10 minutes
  • Deploy to the cloud of your choice – 5 public clouds and +100 regions supported
  • High performance nodes based on carefully selected instance types
  • Bring-your-own-account (BYOC) deployment model supported for strict control requirements

Connect

Integrate with your data infrastructure

  • One-click integration to Aiven services, and easy monitoring with pre-built dashboards
  • Monitor the health of your Aiven services with pre-built dashboards
  • Secure network connectivity using VPC peering, PrivateLink , or TransitGateway technologies
  • Integrate with your favorite logs management solutions — from OpenSearch to Google Cloud Logging, and more
  • Include your Aiven infrastructure in your Terraform tooling to easily build, configure and manage your Aiven services.

Enjoy

An all-seeing eye for your metrics and more

  • Ready-made dashboards for a fast and flexible solution to monitoring
  • 60+ advanced panel and data source plugins available
  • Create monitoring solutions for all your teams
  • Implement an observability platform with alerting

Start building your monitoring environment now

Get started for free

No credit card required.

Pricing plans

Plug it in. Pay as you go.

Once you connect Grafana to your Aiven services, you’re good to go. All-inclusive pricing means you never get end-of-the-month surprises. And there’s no add-on maintenance, networking, or storage fees.

  • Startup

    starting from

    $45/month

    $0.06/hour
    • 1 dedicated VM
    • 2 CPU per VM
    • 1-8 GB RAM per VM

    Add-ons

Need help? Use our Pricing Calculator to get a recommended plan based on your unique data needs and requirements.

Data retention is only limited by storage. For information about annual discount or plan capacity beyond the listed plans, please contact us

FAQ